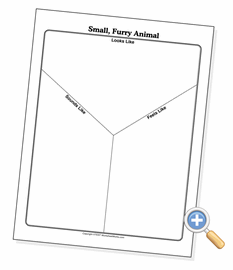
Y-Chart
A Y-Chart is a three-part graphic organizer that is used for describing three aspects of a topic. Examples include observations of an object (looks like, sounds like and feels like) or the characteristics of the three branches of the United States Government (executive, legislative and judicial branches).
Y-Chart Options
Page Title:
Top Section Title:
Left-Side Title:
Right-Side Title:
Layout & Presentation Options
Paper Size:


