Graphing Linear Equations

Use a linear function to graph a line
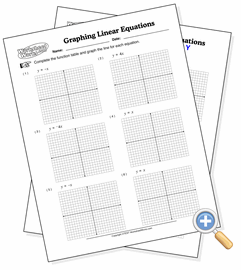
This worksheet includes the task of completing a function table from a linear equation and graphing the line that it describes. You can choose from up to four types of equations depending on the sophistication of your students.
Copyright © 2002-2026 WorksheetWorks.com All Rights Reserved.